How to Track your Finances with our Budget Planner Templates
Introduction
Do you want a quick and simple tool to help manage your finances? Do you also have zero idea where to start when you wanna budget? Then you’ve come to the right place! In this tutorial I'll be showing you how easy it is to budget with our templates! And remember, you don’t need any technical background to use our tools!
Use our Budget Tracker Templates to elevate your budgeting and work towards gaining your financial freedom!

Once this tutorial is completed you'll be able to have your very own dynamic and automated budget dashboard. The tool is completely customizable. That means your income, expense and savings categories can be defined by you, making this super flexible!
Our templates are built with dynamic charts, allowing you to easily review your budgets across different time periods and dates at the click of a button! Use our tools to take the difficulty out of budgeting and empower you to stay on top of your finances!
Budget Planner Guide
Once you have access to the template you will need to open it up within Google Sheets. You'll notice 4 tabs at the bottom; Categories & Goals, Transactions, Budget Dashboard & 12 Month View. We'll begin this tutorial with the Categories & Goals section.
1. Categories & Goals

In this section you'll need to define all your income and expense categories. You have up to a maximum of 20 income and expense categories that you can define which should be more than enough.
Note: We have highlighted any cells that requires you to input data as light orange
See above some examples of income and expense categories which you can also use as a guide. If you don't need them you can replace or delete them!
In our Income example below we have a goal/target of $1,600 each month for our main income and $200 each month for other income. Once you enter the monthly goal (highlighted in light orange), the other time periods will be calculated automatically.

In our Expense example below we have a goal/target of $100 each month for our childcare and $100 each month for other Clothing. Again, once you enter the monthly goal, the other time periods will be calculated automatically.

Finally you'll need to define your savings accounts. This can include saving bank accounts, investment accounts or rainy day accounts. Once you have defined the accounts, you need to enter the % of savings that you want to allocate to each of these accounts. In the example below we have 30% allocation to our savings account, 10% to our investment fund, 50% to credit card debt payoff and 10% to our rainy day fund.

At the top of this page you can see the amount you’re planning to make each year, the Annual Income Goal, which is the sum of all your income goals for the year, and the amount you’re planning to save each year, the Annual Savings Goal, which is the difference between your Yearly Income Goals and Expense Goals.

Now that you've defined your categories and goals it's time to move onto the transactions section!
2. Transactions

In this section you will be entering all your transactions each month and then tagging them with the relevant income and expense categories that you defined in the Categories & Goals section.
When entering each transaction you need to enter a date, then select whether the transaction is an income or expense from the dropdown list. Next you'll need to select the category the transaction relates to. All the categories that you have defined will show up here in a drop down list. 
Next you have the details field, which is a free text field where you can add any additional information about the transaction.
Finally you’ll need to enter the amount which must always be a positive value. It doesn't matter if the transaction is an income or expense, make sure the amount is positive.
And that is it for the transactions section.
3. Budget Dashboard
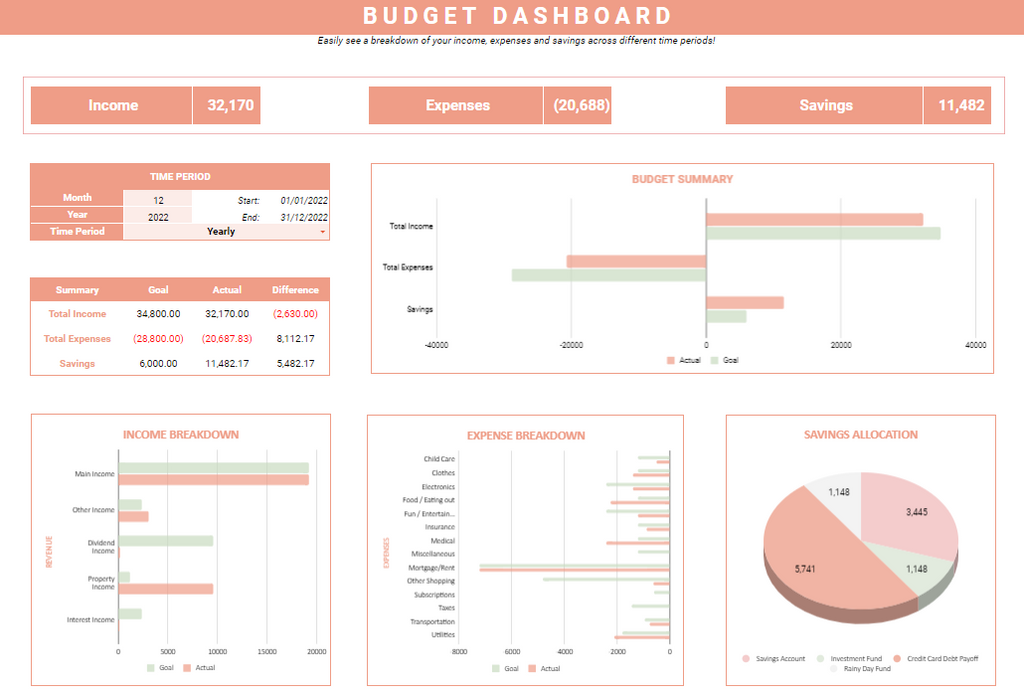
The next part is the budget dashboard section which contains all the dynamic graphs, charts and where you’ll be able to review your finances.
This dashboard may look complicated but we’ve made it super simple for you to use!
The charts and data displayed on this dashboard is driven by the time period that you’ve selected. All you need to do is enter your Month, Year and Time Period and everything updates automatically. Like before, any cells highlighted in light orange will be cells that you need to input data.
In our example below we have December 2022 as the date and the Yearly time period selected. All the graphs, charts are based on 12 months of data between Jan 2022 - Dec 2022.

All the charts update automatically! And you'll be able to easily see your profits, income and expense breakdowns for the year.
You have several time periods that you can select; monthly, quarterly, yearly and full history. Making reviewing different time periods as simple as a click!

If you select full history, your month and year will then be blanked out as these inputs are ignored and the dashboard is based on all your transactions entered. So if you entered 2 years worth of transactions, the whole 2 years will be automatically shown on the dashboards.
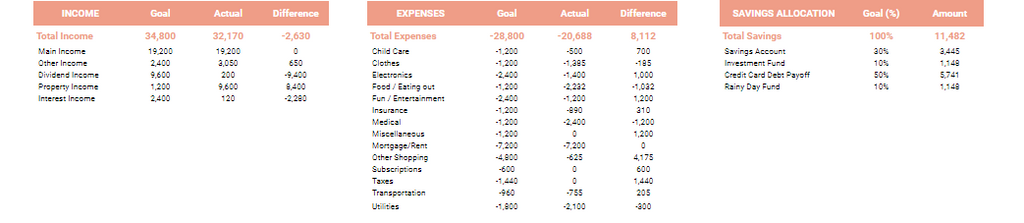
Now to give an overview of all the charts and numbers on the dashboard. Firstly, you have the actual income, expenses and savings at the top. This data is all based on the time period selected. Your Savings is simply the difference between your Income and Expenses.

You can then see your actual figures versus your goals as both numbers or as a graph, depending on what you prefer! This allows you to easily see if you’ve exceeded or fell short of your goals

And towards the bottom we have your income and expense breakdown versus your goals.This is a great way to see exactly what areas are contributing most to both your earnings and spending.

And finally your savings allocation. This shows the amount you should have saved in each of your accounts based on your goals.This is calculated by using your savings total and then splitting it into all your savings accounts based on your goals you defined in the ‘Categories & Goals’ section

4. 12 Month View
The final part is the 12 month view section, which shows your income and expenses across each month, allowing you to see trends and better manage your finances!
The dates shown in this dashboard are based on those entered on the budget dashboard. So if you entered December 2023, this will show the last 12 months up to December 2023.
You can see monthly trends of your total income (green) and total expenses (orange) with this dashboard to better understand your spending habits!

For a more detailed look at your income and expenses, you can see a monthly breakdown across all your custom income and expense categories.


And there we have it! This was a tutorial on how to use our templates to elevate your budgeting and work towards gaining your financial freedom!
Explore our large selection of other Budget Templates that will help you track your finances better!
|
|
 |
|
|
 |

