Best Automated Google Sheets Expense Tracker for any Small Business
Introduction
It can be difficult to stay on top of your business finances. Trying to work out your profit, loss, expenses, cash flows and product inventory can seem overwhelming, which is why we've created this highly effective tool to make your lives much easier! This easy-to-use Google Sheets template will help you track your business expenses, with no technical skills required!
The Perfect Automated Profit, Loss and Expense Tracker for any Small Business
Once you finish the tutorial, you'll quickly learn about how to use all our different dashboards! These dashboards track your business income, expenses, profits, and cash flows. You’ll also be to customize the income and expense categories to make this tracker completely flexible and bespoke to your business!
In addition, you’ll have an automated product inventory allowing you to easily see your highest selling products, your inventory held and the average cost & sales price for each product!
We've created our templates with dynamic dashboards for easy analytics, allowing you to review your business across different time periods and dates with just a few clicks! Use our tools to take the difficulty out of monitoring your business!
Business Expense Tracker Guide
Once you have access to the template you will need to open it up within Google Sheets. You'll notice 10 tabs at the bottom; Categories, Goals, Transactions, Overview, 12 Month View, Custom View, Revenue Calendar, Expenses Calendar, Product Inventory and Invoice. We’ll begin the tutorial with the Categories section.
1. Business Categories
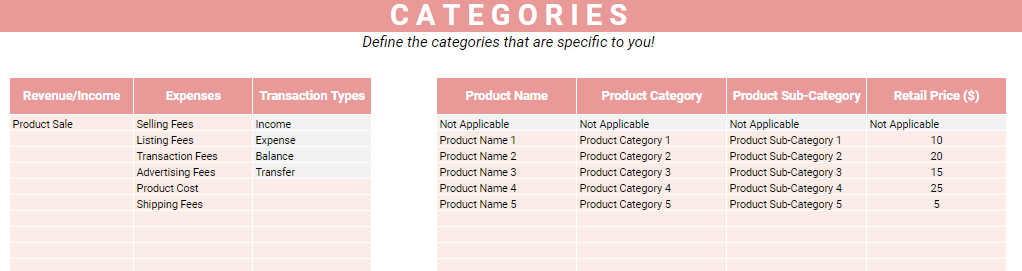
In this section you will need to define your income and expense categories which allows you to tailor this tracker to your business. You will also need to define all your products and you can add more transaction types if needed (although this is optional).
Whenever you update, add, or remove a category on this sheet, it will automatically update on the other dashboards. You’ll have a maximum of 15 income and expense categories and almost 1,000 products that you are able to define and we’ve highlighted the cells where you need to input your data in Pink!
You will also need to make sure that the category and product names you define are completely unique! To give you an example, we have provided some categories and products above that you could use.
2. Business Goals

In the next section you will define the goals or targets you have for all your income and expenses. Once defined, you will easily be able to track your actual revenue / expenses versus your goals.
All the categories that you defined in the previous section will automatically populate here. All you need to do is fill in the monthly goal/targets and all the other time periods will update! To make things simple we have highlighted the cells in pink which you need to fill in.
In our Income example below, we have a goal/target of $1,500 each month for Product Sale. Once you enter the monthly goal (in the cells highlighted in pink) all the other time periods will calculate automatically.


At the top you can see the total income target for the year, the Annual Revenue Target, which is the sum of all your income stream goals for the year. Next to this we have the Annual Profit Target, which is the difference between your Total Yearly Income Goals and Total Yearly Expenses. Again this calculates automatically!

3. Business Transactions

In this section you will be entering all the transactions that have occurred within your business which will automatically drive the dashboards and graphs in the other worksheets. You only need to populate the cells highlighted in pink.
When entering each transaction, you need to first enter a date, and then select the transaction type and transaction sub-type the transaction relates to. This will be a drop-down list based on the income and expense categories you defined in the categories section.
For example if the transaction was a Product Sale, you should select the category as "Income" and the transaction sub-category as "Product Sale"
Next you have the Payee field, which is a free text field where you can add the payee details.
Following this you have the Product Name field, which is another drop-down list based on the products you defined in the categories section. Once you select a Product Name, the Product Category, and Product Sub-Category will update automatcially.
Next you need to enter the quantity (if applicable). This will usually be for product cost and sale transactions. Then you will need to enter the Income or Outgoing amounts. Enter an Incoming amount if its money you receive or an outgoing amount if its money that you spend.
Finally you'll see a Total Balance column which calculates automatically based on the transaction amounts you enter!
4. Business Overview Dashboard

This automated dashboard provides you with a snapshot of your business over the last 12 months. You can see how much you’ve made in total, how much money you’ve spent and the corresponding profit. It also highlights your expense breakdown by category to help you make more informed decisions.
All the charts and data throughout most of the dashboards are driven by the month and year you enter on this sheet. In the example above we have entered the December 2022 as the time period and the data shown will be based from 1 January 2022 – 31 December 2022. This is the only place you should input data and we’ve highlighted this in pink.
If you wanted to see 1 Jan 2023 – 31 December 2023, all you need to do is update the year to 2023 and everything will update automatically. This allows you as the user to better monitor your business!
In the centre you can also see the overall revenue, expenses, and profits for the 12 months up until the date you have entered.
The Profit Goal and Revenue Goal Progress values are your actual profits and revenue versus those estimated on your goals worksheet to see how you are doing versus your targets!
This dashboard has a ton of useful information that can help you understand how your business is doing. You get a good idea of our monthly trends and which expenses are the biggest contributors!
5. Business 12 Month View


The next dashboard goes into a lot more detail, allowing you to easily see your income, expense & product breakdowns each month for the last 12 months!
The data here is fully automated and is driven by the month and year you entered on the overview dashboard. You should not input anything on this dashboard.
At the top we have charts that will show your profit, expense and income versus your goals on a monthly basis.
Below that you will be able to easily see the breakdown of your profits, income and expenses each month.
At the bottom you will be able to see a product breakdown. This will show the total products held, products purchased and products sold each month over the last 12 months.
6. Business Custom View


We’ve added a separate custom view dashboard that allows you to easily get a snapshot of your business across different time periods. So, if you want to view your business over a month, quarter, year or maybe multiple years, you can do so easily and quickly with this automated dashboard!
Simply enter a start date and select a time period from the drop-down list and everything will update! You have the option to choose Weekly, Monthly, Quarterly, Yearly or Full History.
In the example above we have a report start date of the 1st January 2022 and a yearly time period selected which will result in an end date of 31st December 2022. All the charts and data will be based on this 12-month period.
If a quarterly time period was selected, the end date would be 31st March 2022 and the charts and data will be based on this 3-month period.
If a full history time period was selected the begin date is ignored and the charts and data will be based on ALL the transactions you’ve entered!
To summarize, the custom view dashboard will allow you to easily see the total revenue, expenses and profits alongside your income and expense breakdowns across multiple time periods!
7. Business Revenue Calendar & Expenses Calendar
 |
 |
One of the most important things to understand and manage within any business is your cash flows, and these calendars do that all for you!
Use these automated cash flow calendars to show you which days you received or spent money over the full calendar year. You will not need to input anything on this dashboard and the calendar is driven by the year entered on the overview dashboard!
8. Business Product Inventory

Poor inventory management can be a huge burden, especially when you have to do it manually. That's why we built an automated dashboard that automatically tracks your highest selling products, your inventory held and the average cost & sales price for each product!
You do not need to input anything on this dashboard!
9. Business Invoice Template

Also included in the tracker is an invoice template which you can use to send invoices to your customers. This template is linked to your products defined on the categories page, making it much quicker to populate. You can easily add discounts, taxes and shipping to the invoice and let the template do the rest of the work for you!
And that's it! With the help of our small business tracker, you'll be able to master your business finances and make better, more informed decisions.