Easily Track your Airbnb Income & Expenses with our Property Tracker
Introduction
Keeping track of your Airbnb property rental business can be tough, which is why we wanted to provide you with a simple but highly effective tool to manage and monitor it! In this tutorial we will show you how simple it is to track your Airbnb property rentals with our automated template! And remember, you don’t need any technical background to use our tools!
The Perfect Automated Business Tracker for your Property Rental Business
Once this tutorial is complete, you'll have an overview of all our automated dashboards. These dashboards track your property rental income, expenses, profits and cash flows. You’ll also be to customize the income and expense categories to make this tracker completely flexible and bespoke to your business!
Our templates are built with dynamic charts, allowing you to easily review your rental business across different time periods and dates with just a few clicks! Use our tools to take the difficulty out of monitoring your Airbnb property rental business!
Property Tracker Guide
Once you have access to the template you will need to open it up within Google Sheets. You'll notice 7 tabs at the bottom; Categories, Goals, Transactions, Overview, 12 Month View, Custom View and Cash Flow Calendar. We’ll begin the tutorial with the Categories section.
1. Categories

In this section you will need to define your income and expense categories which allows you to tailor this tracker to your Airbnb property rental business. Whenever you update, add, or remove a category on this sheet, it will automatically update on the other dashboards. You’ll have a maximum of 15 income and expense categories that you are able to define and we’ve highlighted the cells where you need to input your data in light blue!
You will also need to make sure that the category names you define are completely unique!
Above we have some examples of the types of income and expenses you may want to define. We’ve aimed to make these trackers highly customizable, for example you can track multiple properties on one spreadsheet or create a copy of the tracker for each individual rental property and track them separately, the decision is up to you!
2. Goals

In the next section you will define the goals or targets you have for all your income and expenses. Once defined, you will easily be able to track your actual revenue / expenses versus your goals.
All the categories that you defined on the previous section will populate here automatically. All you need to do is fill in the monthly goal/targets and all the other time periods will update automatically! To make things simple we have highlighted the cells in light blue which you need to populate.
In our Income example below, we have a goal/target of $1,500 each month for Property 1 and $995 each month for Property 2. Once you enter the monthly goal (in the cells highlighted in light blue) all the other time periods will calculate automatically.

In our expense example below, we have a goal/target of $450 each month for Management expenses and $200 each month for electricity expenses.

At the top you can see the total income target for the year, the Annual Revenue Target, which is the sum of all your income stream goals for the year. Next to this we have the Annual Profit Target, which is the difference between your Total Yearly Income Goals and Total Yearly Expenses.

3. Transactions

In this section you will be entering all the transactions that have occurred within your property business which will automatically drive the dashboards and graphs in the other worksheets. You only need to populate the cells highlighted in light blue.
When entering each transaction, you need to first enter a date, and then select the transaction sub-type the transaction relates to. This will be a drop-down list based on the income and expense categories you defined in the categories section.
For example if the transaction was a management expense, you should select that category from the drop-down list.
Next you have the details field, which is a free text field where you can add any additional information about the transaction.
Finally you’ll need to enter the amount which should be positive for income and negative for expenses.
There is a column at the end defined as Transaction Type and highlighted in Grey. This column contains formulas and you should not update anything here!
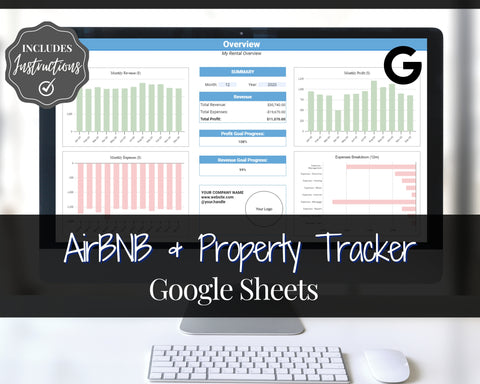
4. Overview Dashboard

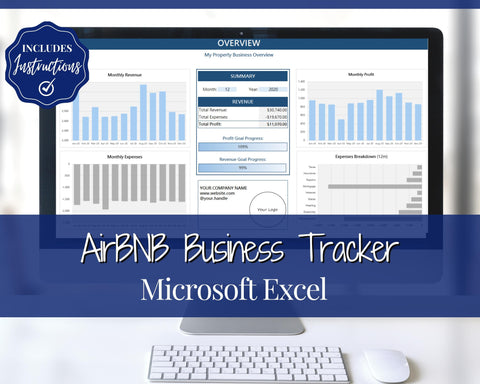
This automated dashboard provides you a simple yet valuable summary of your business over the last 12 months. You can see your total revenue, expense and profits across the last 12 months alongside your expense breakdown split by the categories you’ve defined!
All the charts and data throughout most of the dashboards are driven by the month and year you enter on this sheet. In the example above we have entered the December 2020 as the time period and the data shown will be based from 1 January 2020 – 31 December 2020. This is the only place you should input data and we’ve highlighted this in light blue.
If you wanted to see 1 Jan 2021 – 31 December 2021, all you need to do is update the year to 2021 and everything will update automatically. This allows you as the user to better monitor your property business!
In the centre you can also see the overall revenue, expenses, and profits for the 12 months up until the date you have entered.
The Profit Goal and Revenue Goal Progress values are your actual profits and revenue versus those estimated on your goals worksheet to see how you are doing versus your targets!
This dashboard is very powerful, providing you with a lot of insight into how your business is doing, the monthly trends and what the biggest expense contributors are!
5. 12 Month View


The next dashboard goes into a lot more detail, allowing you to easily see your income and expense breakdowns each month for the last 12 months!
The data here is fully automated and is driven by the month and year you entered on the overview dashboard. You should not input anything on this dashboard.
At the top we have charts that will show your profit, expense and income versus your goals on a monthly basis.
Below that you will be able to easily see the breakdown of your profits, income and expenses each month.
6. Custom View


We’ve added a separate custom view dashboard that allows you to easily get a snapshot of your property rental business across different time periods. So, if you want to view your property over a month, quarter, year or maybe multiple years, you can do so easily and quickly with this automated dashboard!
Simply enter a start date and select a time period from the drop-down list and everything will update! You have the option to choose Weekly, Monthly, Quarterly, Yearly or Full History.
In the example above we have a report start date of the 1st January 2020 and a Yearly time period selected which will result in an end date of 31st December 2020. All the charts and data will be based on this 12-month period.
If a quarterly time period was selected, the end date would be 31st March 2020.
If a full history time period was selected the begin date is ignored and the charts and data will be based on all the transactions you’ve entered!
To summarize, the custom view dashboard will allow you to easily see the total revenue, expenses and profits alongside your income and expense breakdowns across multiple time periods!
7. Cash Flow Calendar

One of the most important things to understand and manage within any business is your cash flows, and this calendar does that all for you!
Use this automated cash flow calendar to show you which days you received or spent money over the full calendar year. You will not need to input anything on this dashboard and the calendar is driven by the year entered on the overview dashboard!
The % Earnt of Total Profit Goal looks at the total profit for the year versus your estimated yearly profit based on the goals you set.
And that's it! With our tracker templates, you'll be able to master your Airbnb property rental business.
Want an Excel Version of the Airbnb Property Rental Tracker? Then click here!